Struggling with finding the right metrics to track growth?
Tracking and benchmarking business growth through metrics is a cornerstone of success. At Innoviti we are big believers of the same and have religiously tracked our performance through conventional industry metrics – 7-day average percent of transacting merchants, total existing merchants, etc.
But these metrics rarely tell us much beyond the superficial output- did the merchant use our product to transact or not? We hit a point of stagnation where we were hard pressed to drive strategic decisions using these metrics.
So, we dug deeper. The product owners along with the data-analyst team devised a metric to tease out more informative insights – the Wallet Share Gap.
Every merchant shares a certain part of their business potential which we call the wallet share. The percentage of this potential which they do not share with us is our wallet share gap in their store. The Wallet Share Gap helps us measure how much business we could not acquire depending on their experience.
We got this data by measuring each merchant’s maximum and median volume with us in the past year excluding peak volumes driven by festive seasons. We considered the median as a measure as averages tend to swing based on minimums and maximums.
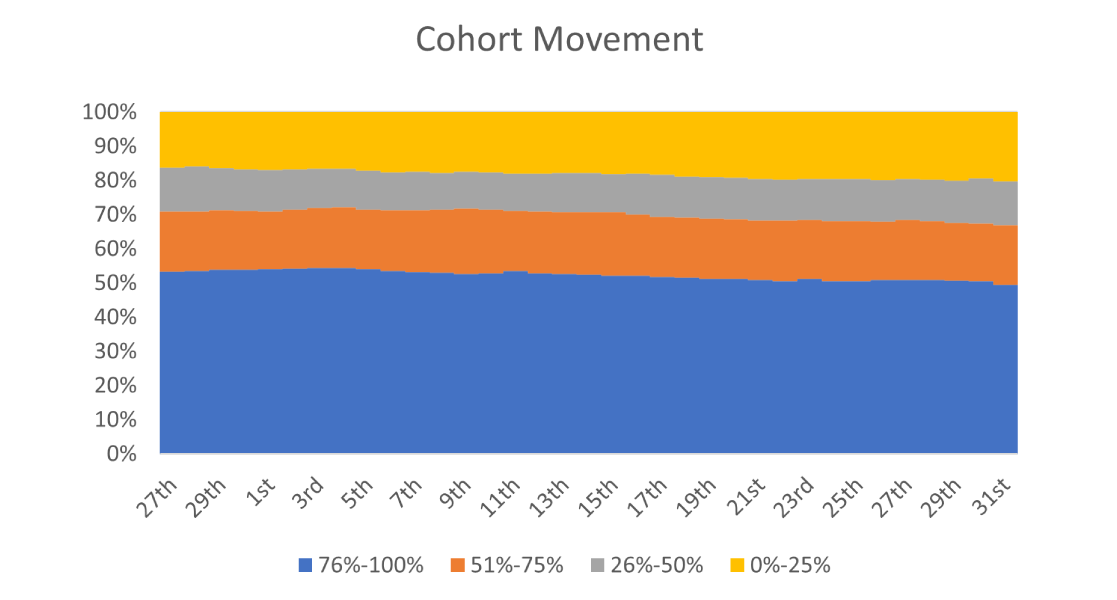
Using this, we categorized our stores into different wallet share cohorts, ranging from our best performers who give us over 90% of their wallet share to our bottom performers who give us less than 10%. We mapped over 2100 stores into cohorts based on their wallet share.
Studying these groups, we realized we had chanced upon a Goldilocks situation- the cohort with the least wallet share gap were anyway giving us the most business, and the ones with the largest wallet share gaps had too many barriers to be influenced positively to close the difference. The cohort in the middle were just right- not ‘too hot’ not ‘too cold’. They were the merchants who were using our product, but their brand affinity and recall was poor. They did not instinctively reach for our product over competitors when processing payments.
Our strategy to drive growth now focused on reducing the wallet share gap within the merchants in this middle cohort and becoming their preferred mode of payment, since we had the most potential to drive preferences toward us.
Through conversations with merchants in the first cohort who have us upwards of 90% of their business, we realised that the reason they preferred us was because they had developed strong brand recall through unique use-cases. They had unlocked and strongly identified with 4 key brand differentiators.
What was interesting was that these differentiators went beyond surface level functional or cost oriented differentiators that are easily replicable by competition.
They were a function of sensorial brand associations built over time. They were modelled around factors such as trust, transparency, a premium feel communicated by the UI and superior operational efficiency.
Using this knowledge we tested a communication strategy for 50 merchants from the merchants in the 2nd cohort- who had a gap of 25%-75%.
- Direction Digital Communication: A 3-day rotational communication strategy was developed, where we would send out a competitor analysis, a merchant testimonial and region-specific language creatives focusing on one of the differentiators. This strategy of communicating the differentiator by benchmarking it against competition and having real merchants highlight the benefits was received very well by the merchants.
- Instore communication with merchants: This streamlined digital communication got us thinking about what our Store Relation Officers who visit these stores are communicating with merchants. Earlier the conversation would centre around nudging the customer to transact through conversations about ongoing promotional offers and generic brand features.Through this three-day strategy we sharpened the pitch to focus strongly on one differentiator at a time. For instance, the premium feel of the UI. The merchant through these conversations starts focusing on how the novel “Cube design” is intuitive, fast and almost fun to use while going through brand SKUs.
- Through streamlined and regular reinforcement of the cube design standing out against the other terminal’s out-dated and stale display, the merchant automatically began reaching for Innoviti’s product
We built a digital communication calendar and created multiple collaterals communicating the differentiators. The on-ground team was updated regarding the communication themes for the week, thereby optimizing effectiveness of each of their store visits.
- We increased our GTV by over 10% with over 38% of our stores moving up in cohorts and jumping in their wallet shares by an average of 6%.
- Our customer insights got better while at the same time, reducing our promotional costs to GTV ratio by 67% without compensating on relations.